HOW TO USE OUR SERVICE
General informationThe Alpinus Spectra service (hereinafter referred to as the Service) is intended for loading, storing, modifying and processing spectral data, including comparing spectra with similarity assessment, for creating, saving and using PLSR, PLSR-DA models.
Information: The Service is in testing mode, therefore changes in functions and interface are possible that are not described in the manual. For additional information, you can use the feedback form.
To gain access to the main functions of the Service, it is enough to authorize via a Google account. The authorization button is in the upper right corner of the working window. After authorization, access to the "My Spectra" and "My Models" workspaces appears. Without authorization, access is only possible to several data sets for the purpose of testing the main functions of the Service. Access without authorization does not provide the ability to load spectra and save models in the database.
The Service is in testing mode, therefore the number of spectra that can be loaded after authorization and the number of models that can be stored are limited. The maximum number of spectra is 250 (both for comparison and for models - predictor matrix or X-block), the maximum number of Y-vectors (response vectors) is 50, the maximum number of PLSR models is 5, the maximum number of PLSR-DA models is 5.
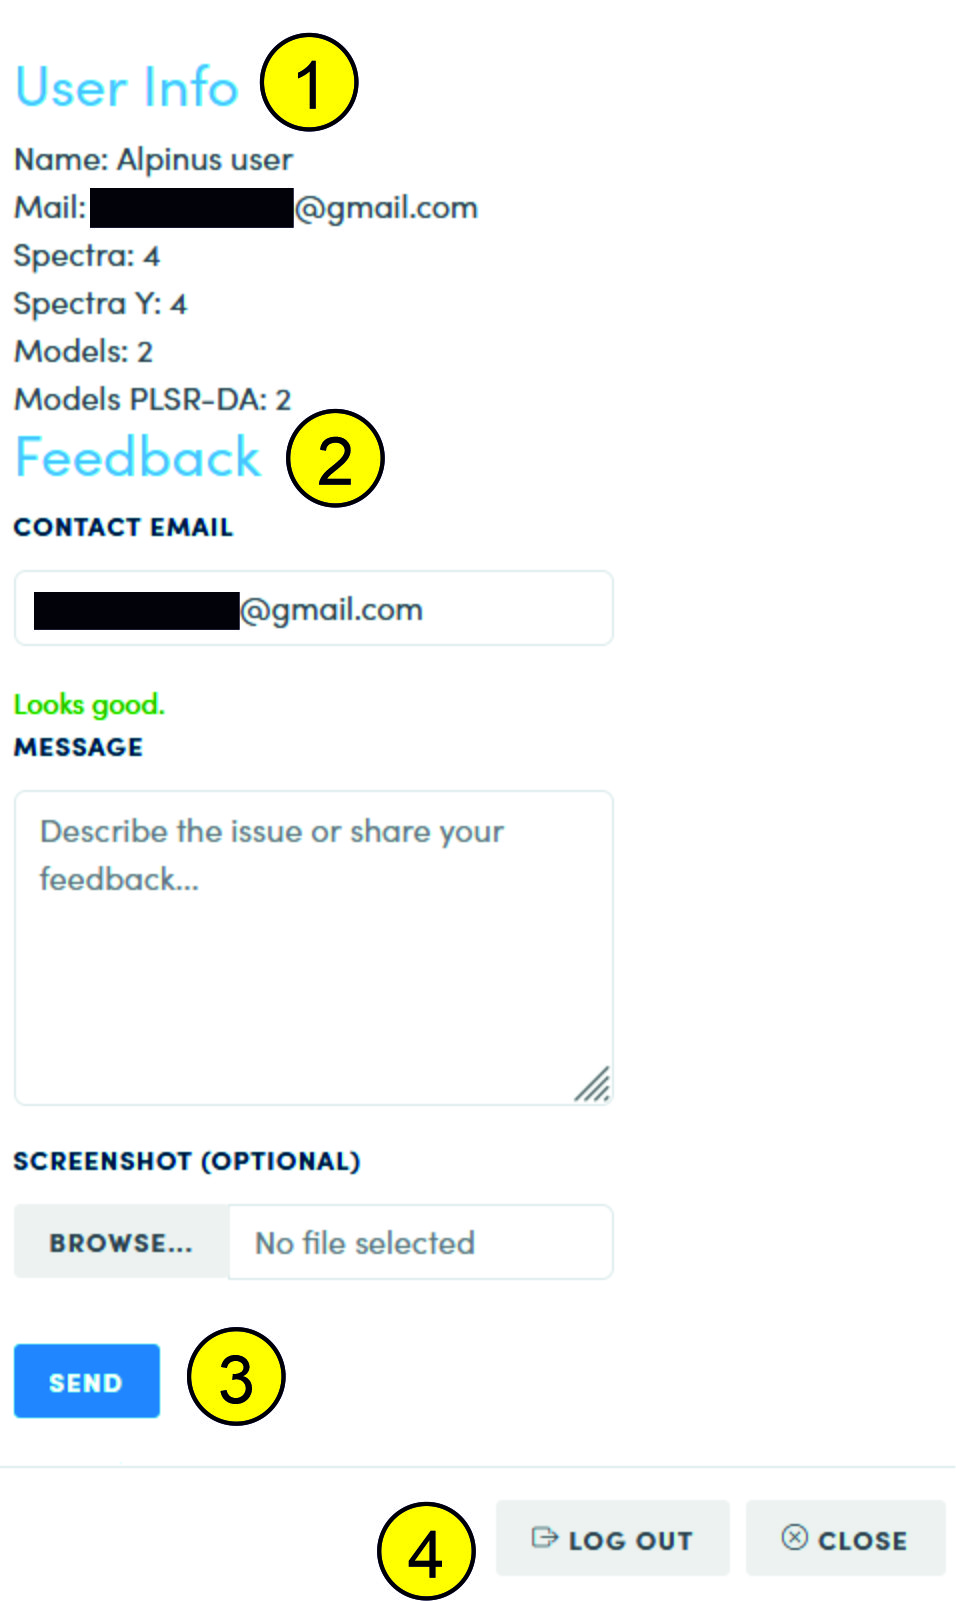
If you click the authorization button again after authorization, you will get access to general information about your spectra (1), to the feedback form (2), which contains fields for:
- Entering a current contact e-mail (by default, the e-mail from the Google account);
- Entering information;
- Attaching a screenshot or other image.
By clicking the button (3), an email with the attached information will be sent to our service department.
At the bottom of the form there is a log out button (4).
This page is only available after authorization. It provides access to your private information - spectra for the comparison and search module, X data matrix and Y-block for modeling, subtypes for spectrum classification, etc. You can download, change and delete any of your information.
Information: all your data is stored in encrypted form, so even in case of unauthorized access to the database, we maintain the privacy and integrity of your data.
The page is divided into a download block (1-6) and a block of available data (7):
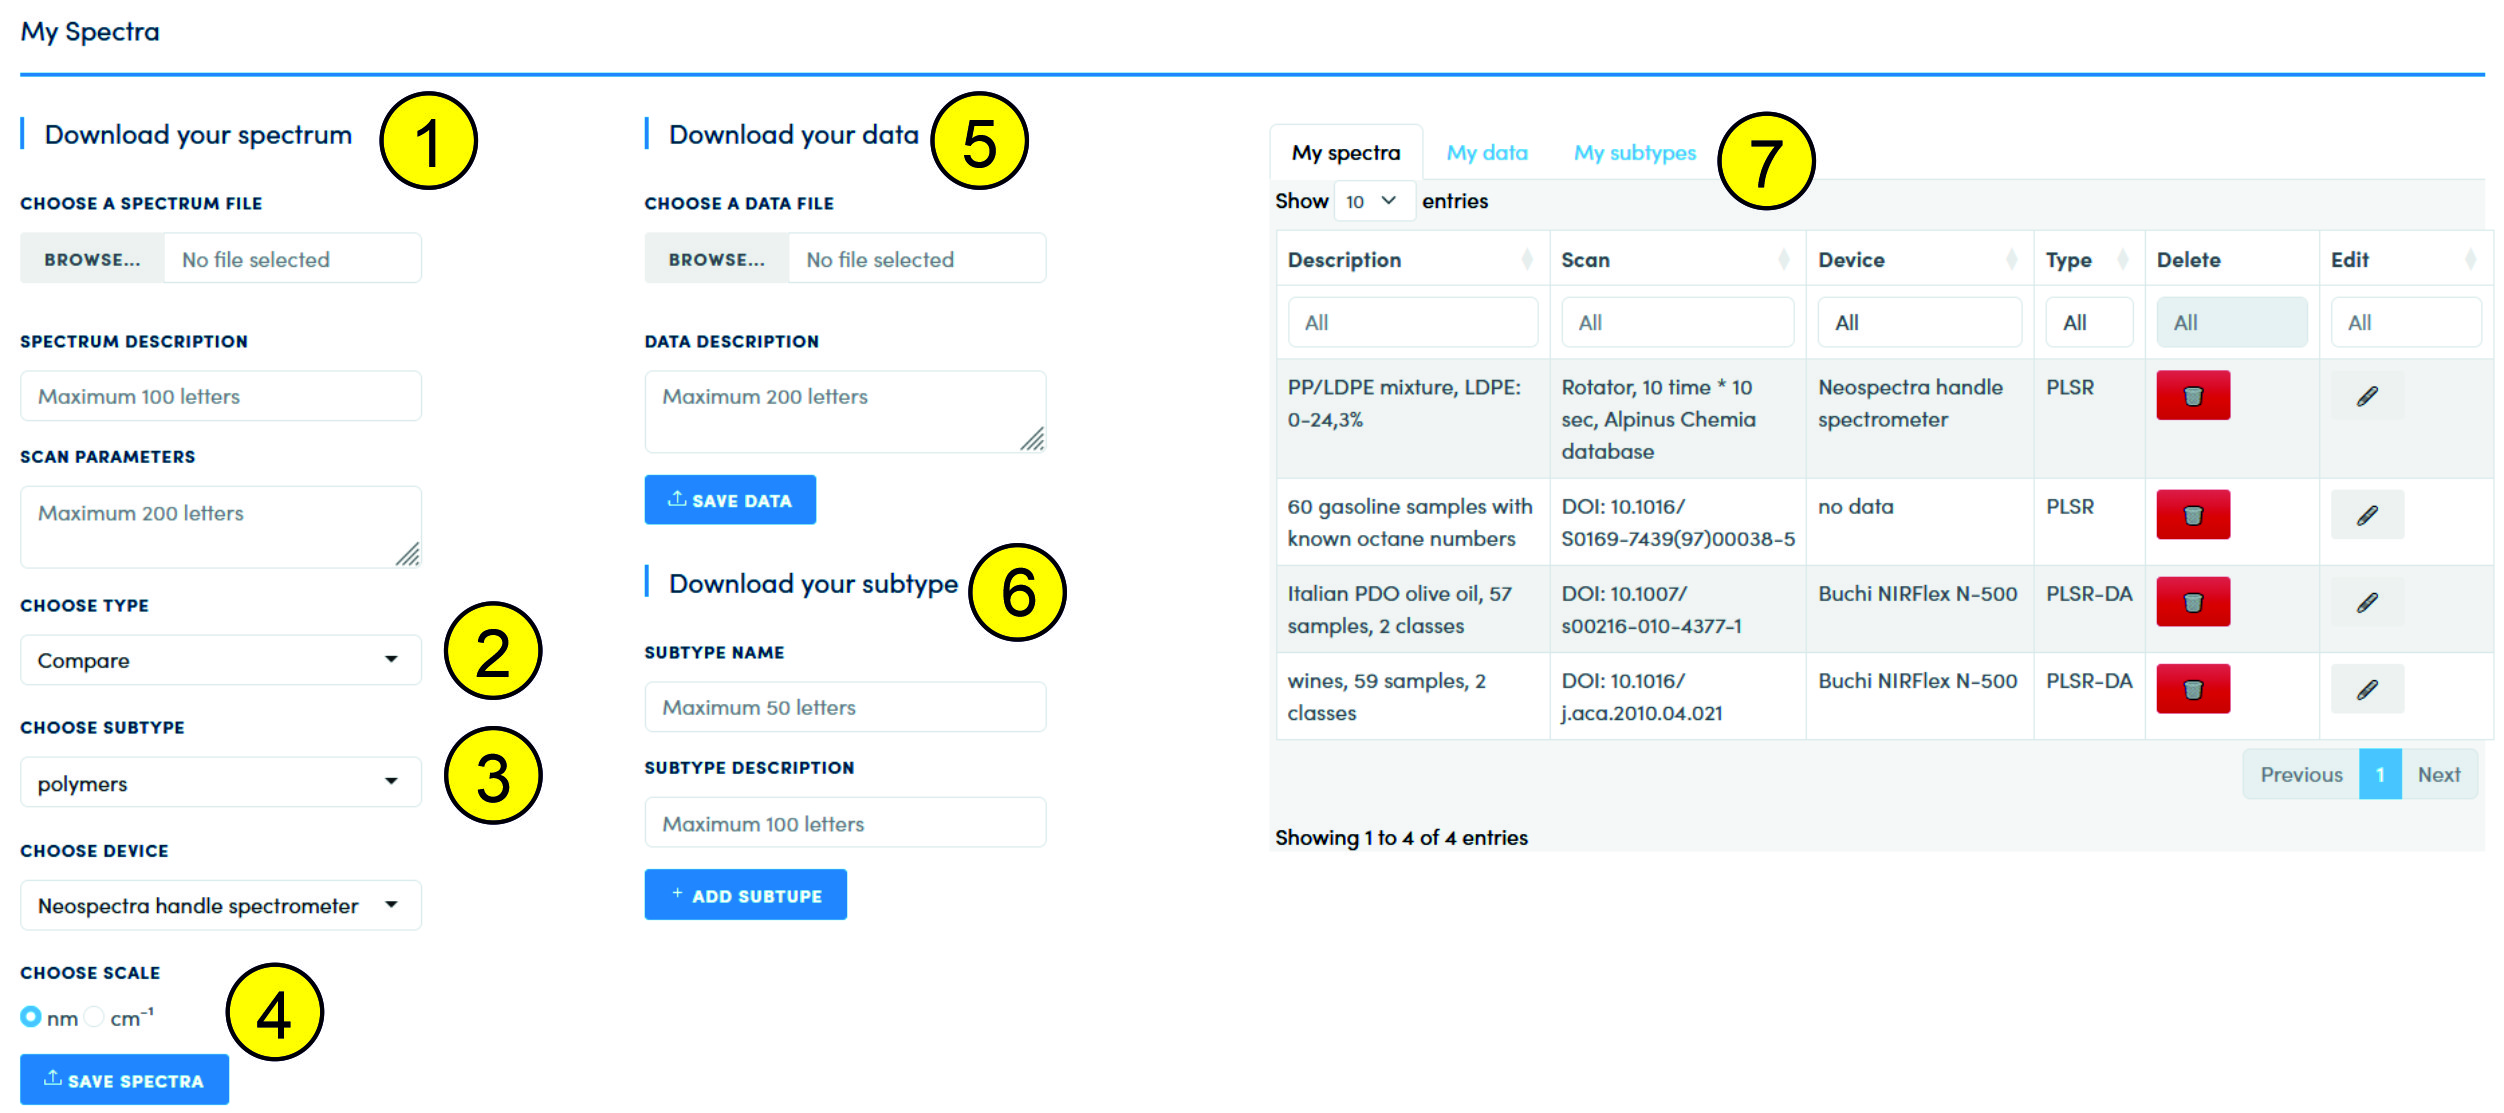
When loading a spectrum (1), it is possible not only to select a file with data in *.csv format, but also to enter information about the spectrum (Spectrum Description) and information about the scan mode (Scan Parameters). This information will be saved in the database and linked to the data set. The choice of data type (2) affects the interface - if "Compare" is selected, then to load the spectrum you need to add a subtype (3). For PLSR, PLSR-DA models, the subtype is not selected. If there is information about which device was used to obtain the spectrum, then it can be selected in the list of devices (Choose Device). If there is no such information, then you can select the "no data" option. If the required device is not in the list, then you should contact the administrator with a request to add this device to the list. By default, all data in the database is stored on the "nm" scale. If the scale in the file has the "cm-1" format, then this format must be specified (4). When loading the file, the conversion to nanometers will occur.
If the spectrum is saved to the database successfully, a corresponding message will appear in the modal window. If a failure occurs during saving, or the data file is damaged, the information will not be written to the database, and the message will contain information about the error.
When loading the Y-vector (5), it is possible to add a description of the information contained in the file (Data Description).
If there is a need to add a new subtype, then you should use the function (6) - loading data about a new subtype. You need to enter the name of the subtype and, if necessary, a description of the subtype. A subtype created by a user is available only to that user. Each user can have his own subtypes, but the main data types are added by the Service administration.
In block (7) there is information about all the data uploaded by the user and about all the subtypes created by the user. Some data fields can be changed; any data and subtypes can be deleted. Attention! - when deleting a subtype, the data associated with this subtype will automatically be permanently deleted. The data in the table can be sorted.
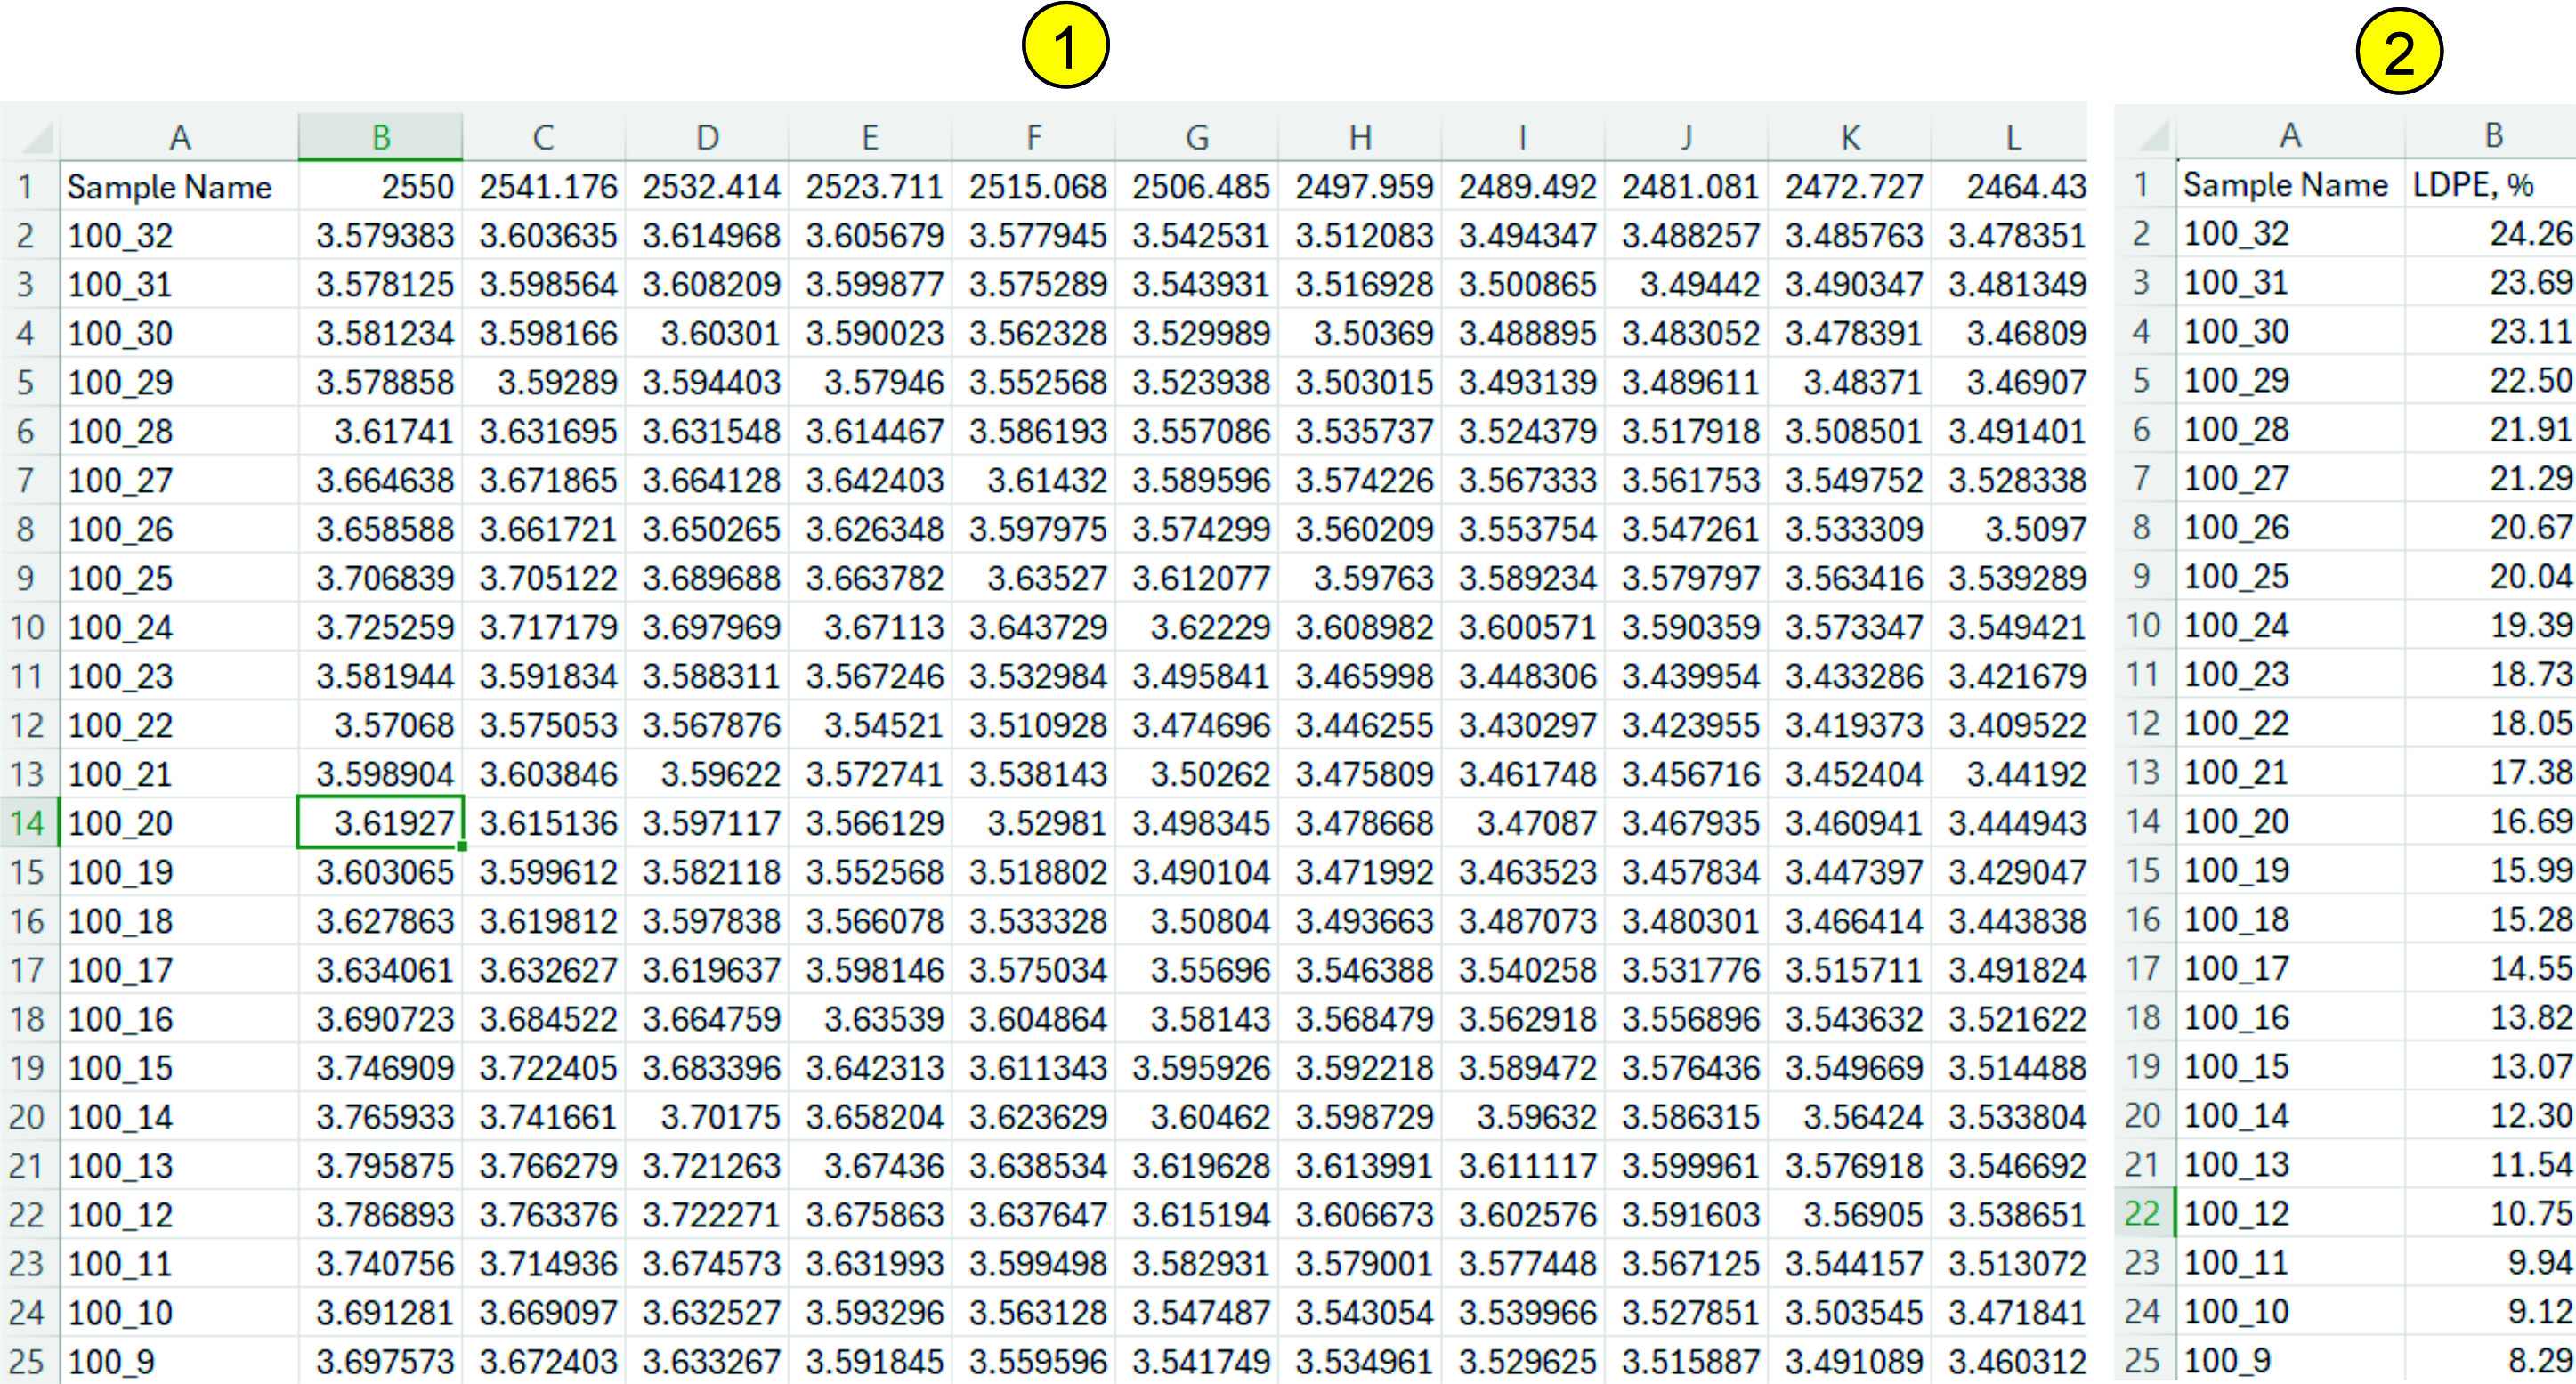
All spectra are downloaded as a *.csv file (square matrix). The first column of the file should contain sample names or numbers; the first row should contain the wavelength. An example of such a spectrum is shown in the following figure (1). If the spectrum matrix contains empty cells, cells with non-numeric values, various artifacts, then such a spectrum will either not be downloaded (you will receive an error message during download) or various errors will occur during processing of such a spectrum. The spectrum matrix should contain from one record to 10,000. If the number of records (samples) is significant (a thousand or more), then the processing speed slows down and the results of processing, searching, modeling should be expected for some time (up to several minutes). Data vectors (Y-block, response vector, reference values) should also be uploaded as a *.csv file. Currently, the Service supports only data vectors, i.e. one spectrum corresponds to one reference value. The appearance of such a file is shown in the following figure (2):
This page allows visualization of the spectrum (set of spectra) and the results of data preprocessing. The preprocessing process (sequence) compiled on this page will be used in PLSR, PLSR-DA modeling.
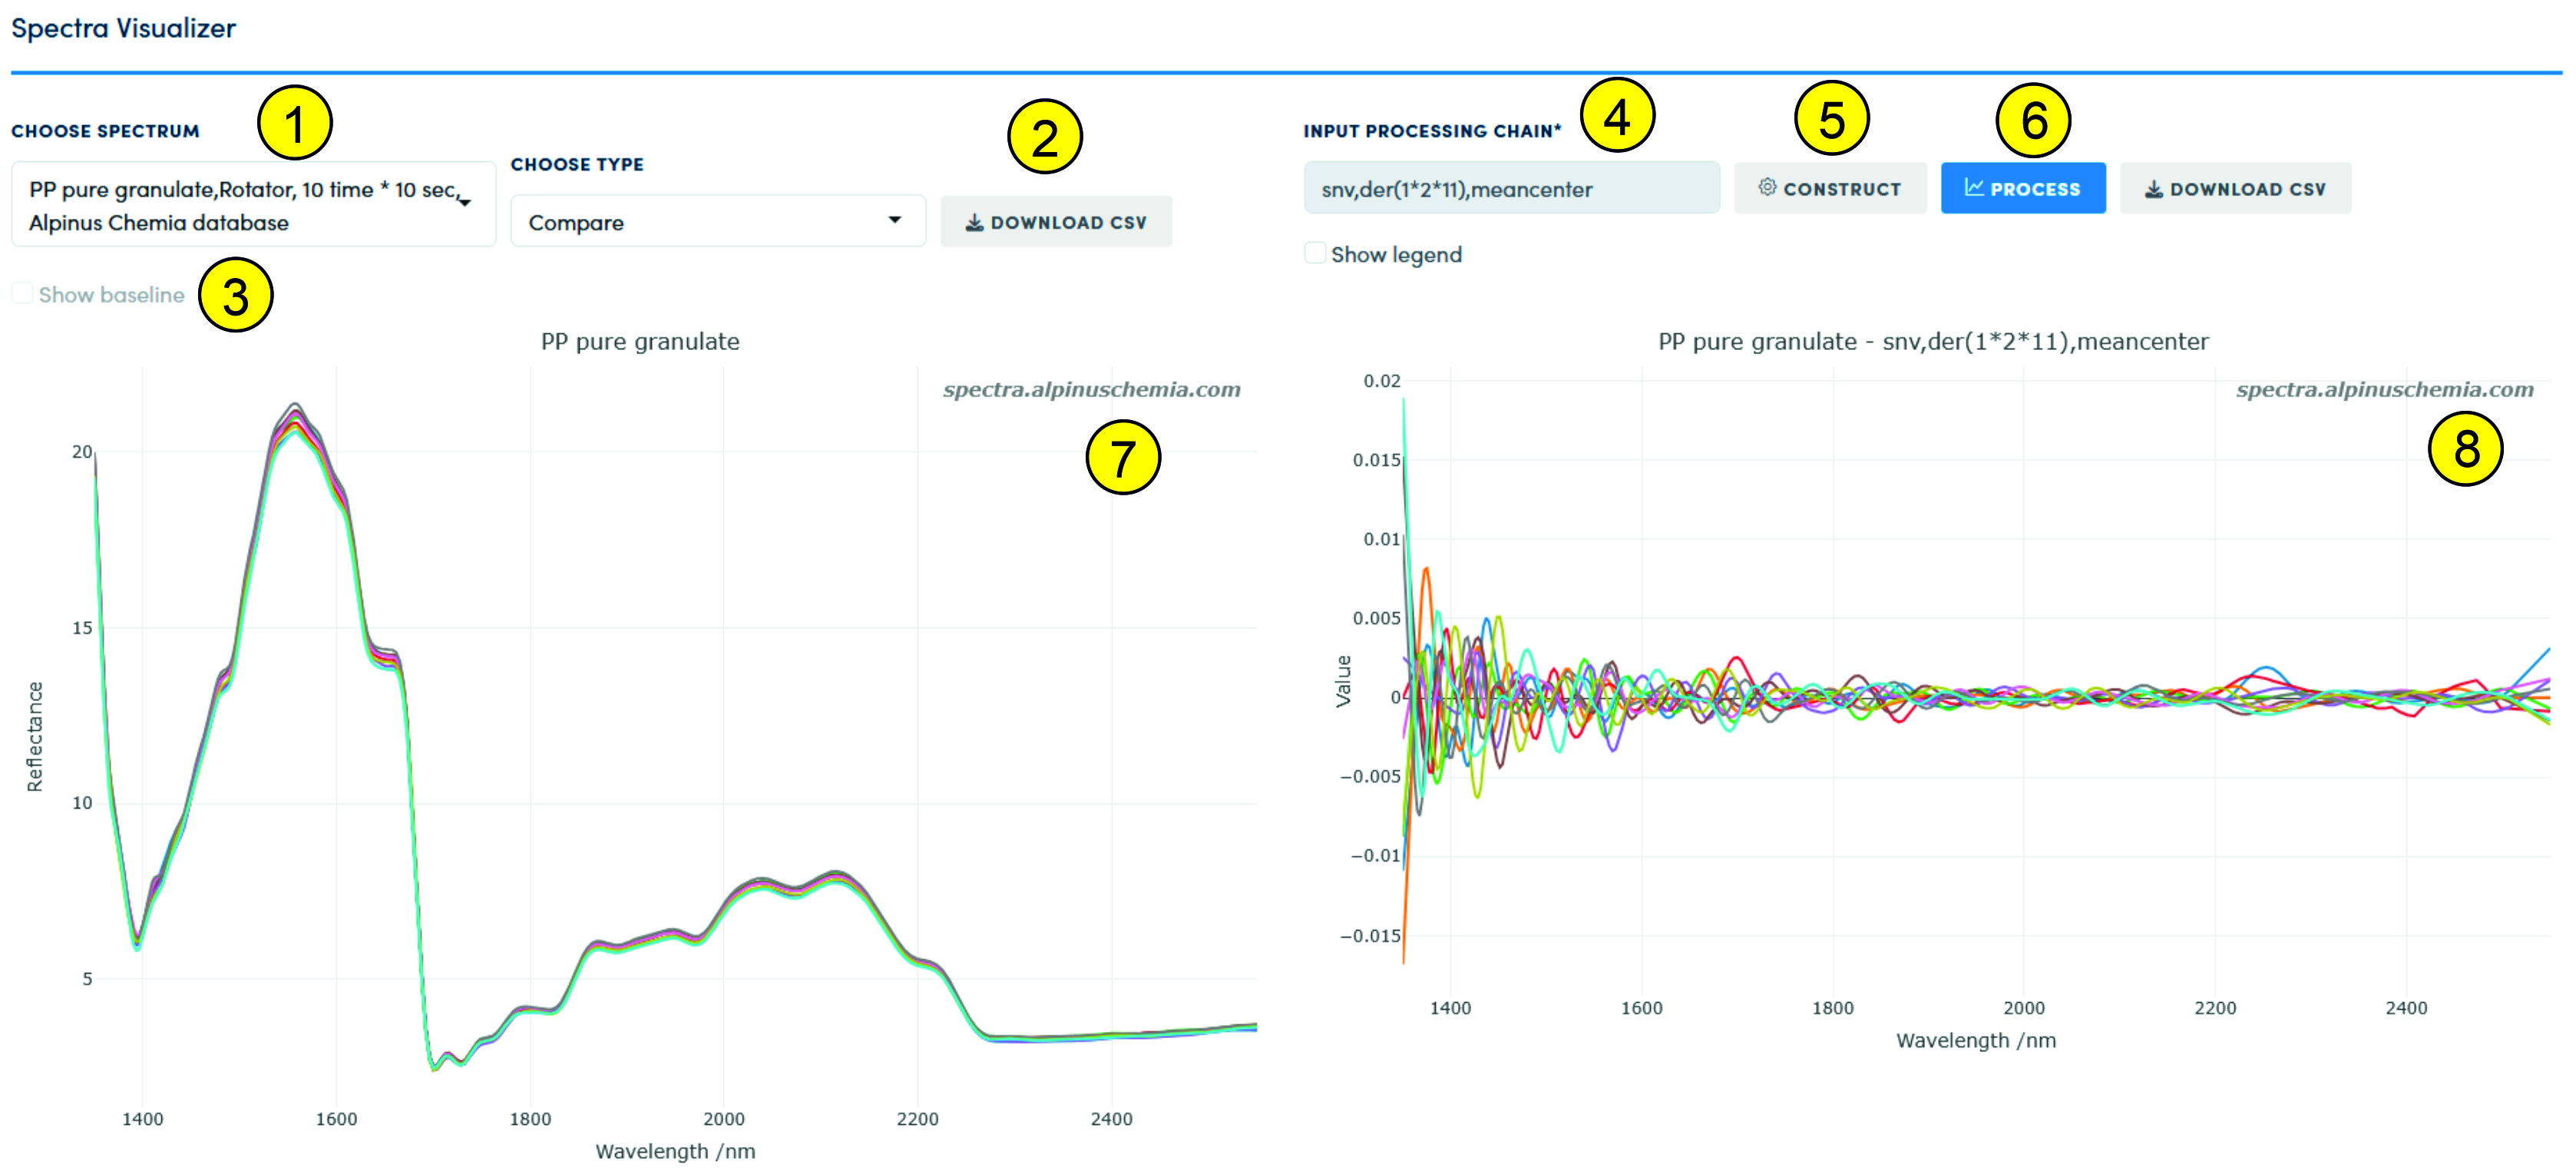
The spectrum (data set) for visualization and preprocessing is selected using the list (1). All data stored in the Service, as mentioned above, are divided into basic types - "Compare", "PLSR", etc. When changing the data type, the list (1) is loaded with data of the selected type. The user can download the data he visualizes - both raw and after preprocessing, using the "Download CSV" function (2). If the user wants to see what the baseline looks like (if it was selected during preprocessing), then this function should be activated (3). If baseline correction was not selected in the preprocessing chain (preprocessing sequence), then this function remains unavailable. Attention - if the baseline correction is not the first function in the preprocessing chain, then its display in the window (7) will most likely be incorrect; at the same time, the result of performing the baseline correction will be correct regardless of its place in the preprocessing sequence. If the user wants to see the legend of the figure, then the "Show Legend" function should be selected. We do not recommend using this function if the number of records in the data set reaches several hundred or more.
The preprocessing sequence is generated by pressing the "Construct" button (5), and the execution of the preprocessing sequence is performed by pressing the "Process" button (6). Information about the selected preprocessing sequence is provided in the text field (4). The result (visualization) of the preprocessing is displayed in field (8). The "Show Legend" function simultaneously displays or hides information from fields (8) and (7).
After calling the preprocessing sequence constructor (6), a modal constructor window is displayed on the page:
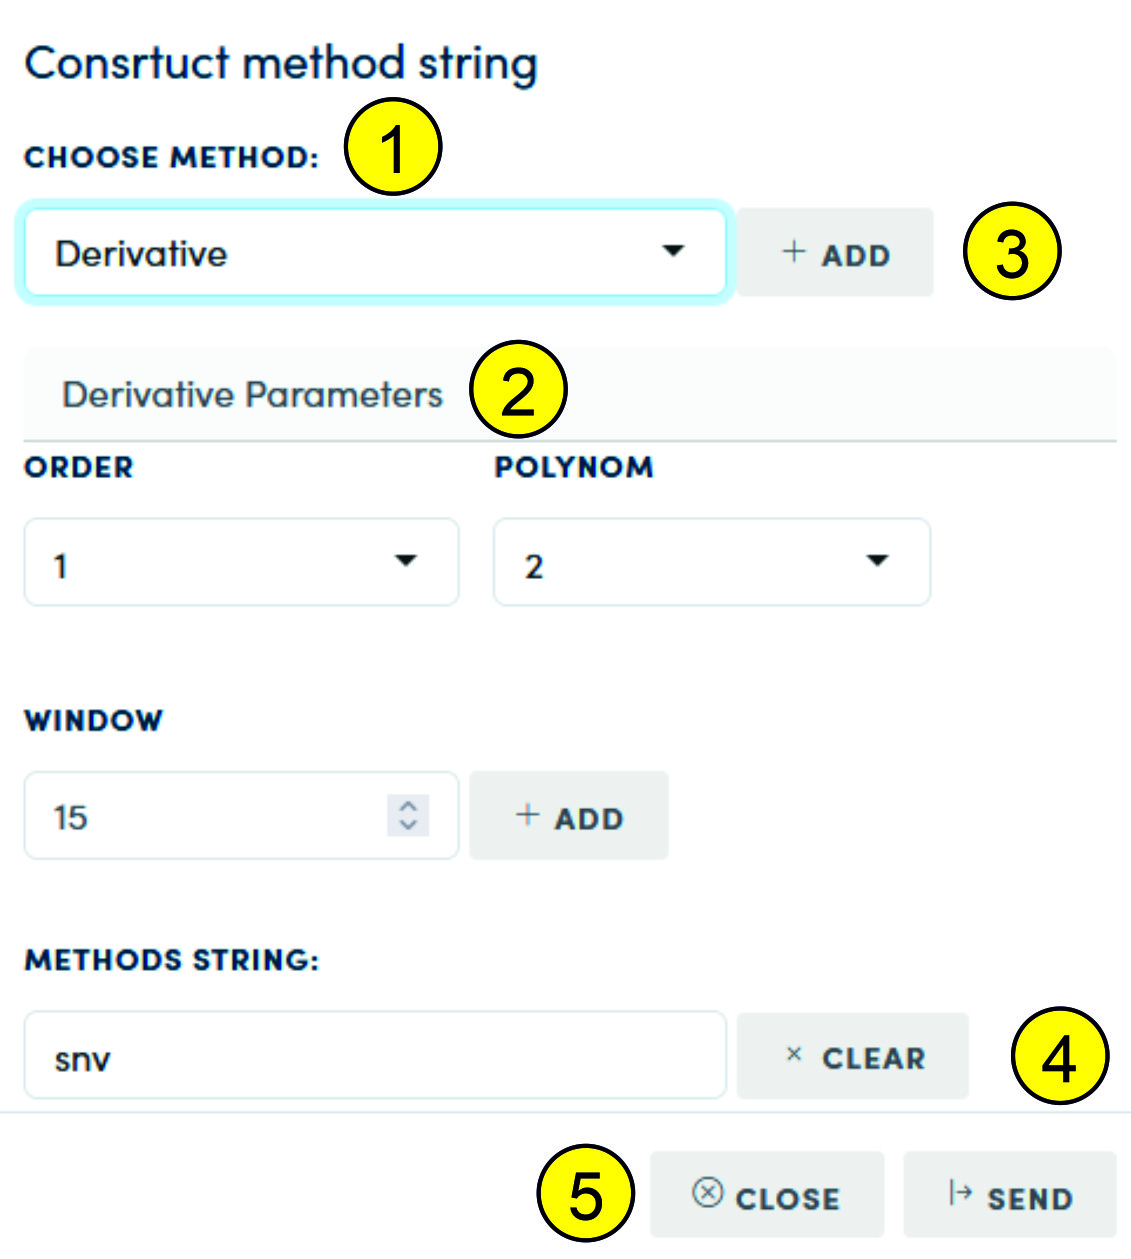
In the list (1) you can select the following preprocessing methods:
- Converting percentages to fractions of a unit;
- Converting transmission to absorption;
- Normalization (three methods);
- MSC;
- SNV;
- Derivative;
- Smoothing;
- Baseline correction;
- Median;
- Mean Center;
- Autoscale.
Attention - the median is used only for the "Compare" data type. As a result of its execution, we obtain a median single value for the data set, which is used as a standard for comparison.
Attention - for PLSR, PLSR-DA, the Mean Center and Autoscale functions are automatically transferred to the end of the transformation chain regardless of where they are in the user sequence. This is done for the sake of expediency and to avoid erroneous preprocessing sequences.
After selecting a function from the list (1) and setting the parameters (if they exist for this function, for example SNV has no parameters), pressing the "Add" button (3) adds the function to the sequence shown in the "Methods String" field (4). Pressing "Clear" clears the preprocessing sequence. If a preprocessing sequence has been created, pressing "Send" sends the sequence to the main visualizer page. To visualize, the user must click "Process" on the main visualizer page.
We recommend always visualizing the results of preprocessing to avoid singularities and other artifacts of spectral data processing.
Comparison of spectraThis page is intended for working with spectra loaded as the "Compare" class. When loaded in this way, the spectra are processed: for all we take the median, additionally two types of first derivatives (different degree of the polynomial and different window). Thus, we get a sample containing the main characteristics of the spectrum. The main function of this page is to search for similarities between spectra. When visualizing and searching for similarities, it is important to select the desired comparison format (3): if only the median is selected, then we compare median spectra, if the derivative+median is selected, then the comparison is performed for spectra that have undergone such preprocessing. For visualization, you should select two spectra that will be shown on the graph (4). The selection is made using the lists (1) for the selected instrument (2) and subtype (Choose Subtype). After selecting the spectra and the comparison format (Choose Method), you should click the Draw button (3) to generate the graph (4).
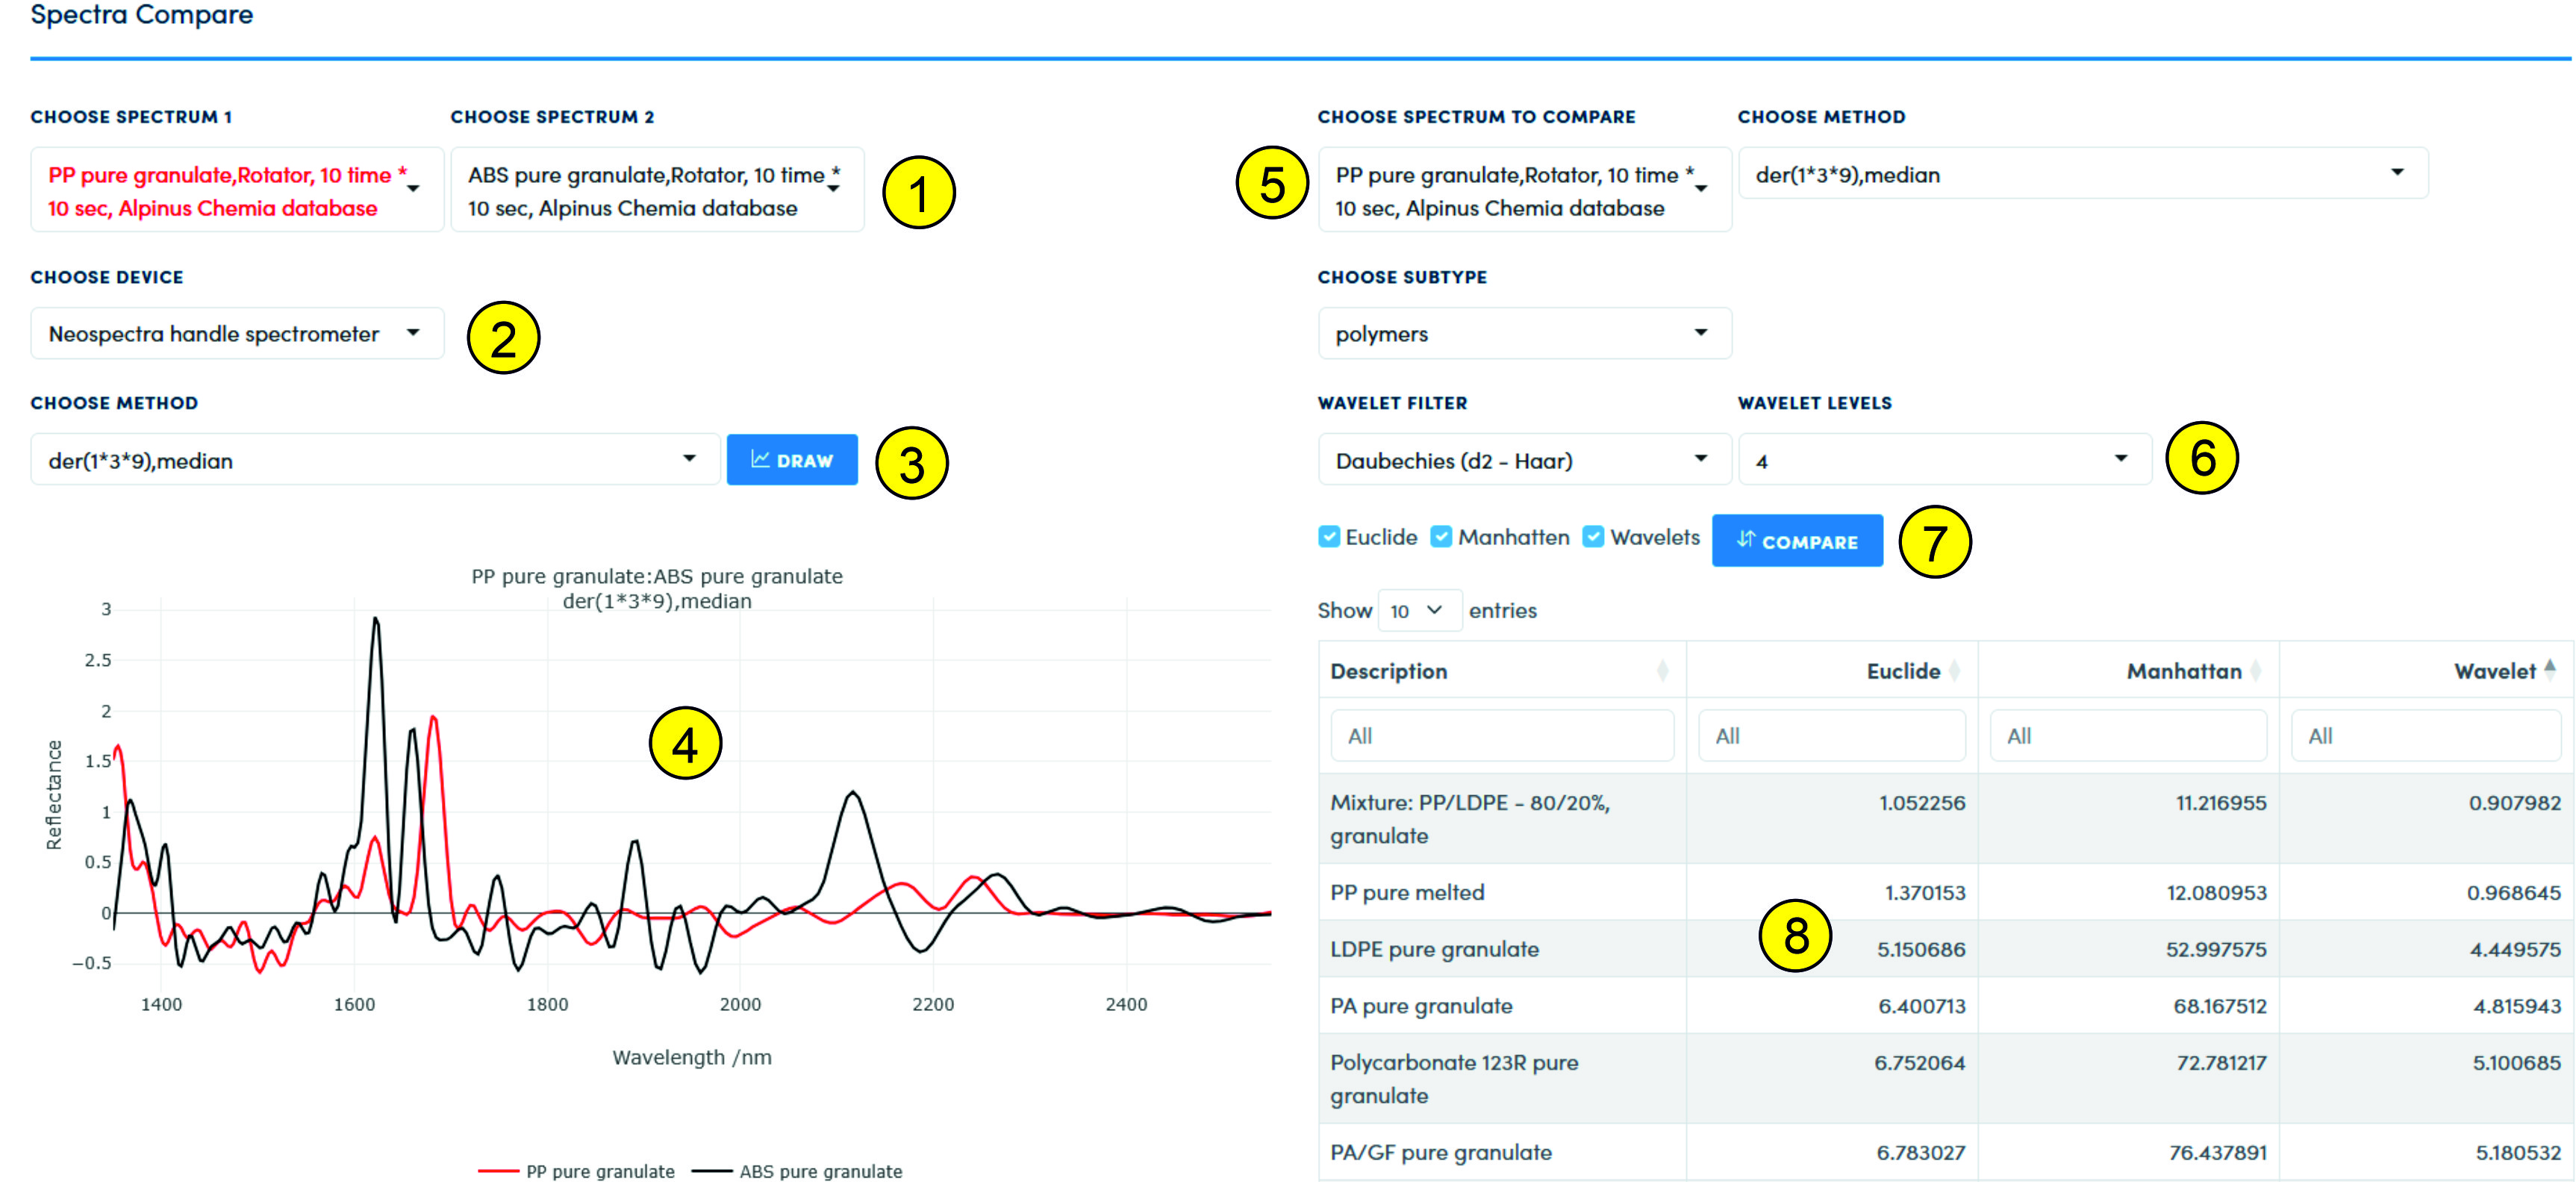
The similarity search is performed after selecting a spectrum with which we will compare all spectra belonging to the same subclass and collected by the selected spectrometer (2). After selecting a spectrum in the list (5) and the method by which the spectrum was processed, as well as, if necessary, selecting wavelet parameters (6), by pressing the "Compare" button (7), the comparison is performed using the selected methods, including Euclidean distance, Manhattan distance and various types of wavelets.
The comparison result is displayed in table (8), where it is possible to sort by different types of comparison.